The More Things Change, the More They Stay the Same
To celebrate my 60th birthday my team gave me an incredible gift, a book of New York Times front pages from each of the past 60 years. A great gift indeed, but also a reminder of the words from Jean-Babtise Alphonse Karr, “The more things change, the more they stay the same.”
Indeed, the more we think things have changed, the more we are reminded they are the same.
Reading through the headlines of the past 60 years I was struck by the familiarity of the messages. Frankly, I thought the headlines were from just yesterday, not five or six decades ago. The patterns seem all too familiar:
- The media openly criticizing and bashing the president
- Muck-raking political journalism (does this sound familiar in today’s political season?)
- Hand wringing over the unemployment rate, and welfare beneficiaries not willing or interested in work
- Negative comments related to business trade with countries we may not be friendly with such as the Russia
- European economy in a slump
- Israel peace talks
- Testing of atomic blasts
- Enemies firing at our naval vessels (Russian MiGs firing at naval boats near Cuba)
- Embassy bombings
Another way of phrasing this point: history repeats.
Consider the first six weeks of the year – the chatter on the likelihood of a soon-to-be bear market. I truly believe financial companies that might stand to benefit from investor uncertainty (like large brokerage firms, fund, and insurance product companies) help “manufacture” these types of stories in an effort to increase their share of selling their products to investors.
I believe part of their business model exists in raising doubt in investors’ minds, then creating their solution (selling investors on something “new”), usually back -tested, and more often than not, selling based on what happened yesterday. They rely on people believing that past performance could indicate future returns. So they buy what went up last year, and focus on strategies that COULD have had great returns.
Nearly every piece of financial marketing material clearly says: past performance is no guarantee of future results – yet no one seems to pay attention or believe these disclaimers.
Remember Money Magazine and how they would tout investors into buying last year’s top performers? Good for selling magazines; potentially detrimental to investors net worth.
So are we going to have a bear market? I don’t know. Nearly 40 years of advising clients and investing their money, I have never found a way to predict short-term direction. If I could, I would, and we’d all be a lot richer as a result.
(MFS Bear Market History 3/2016)
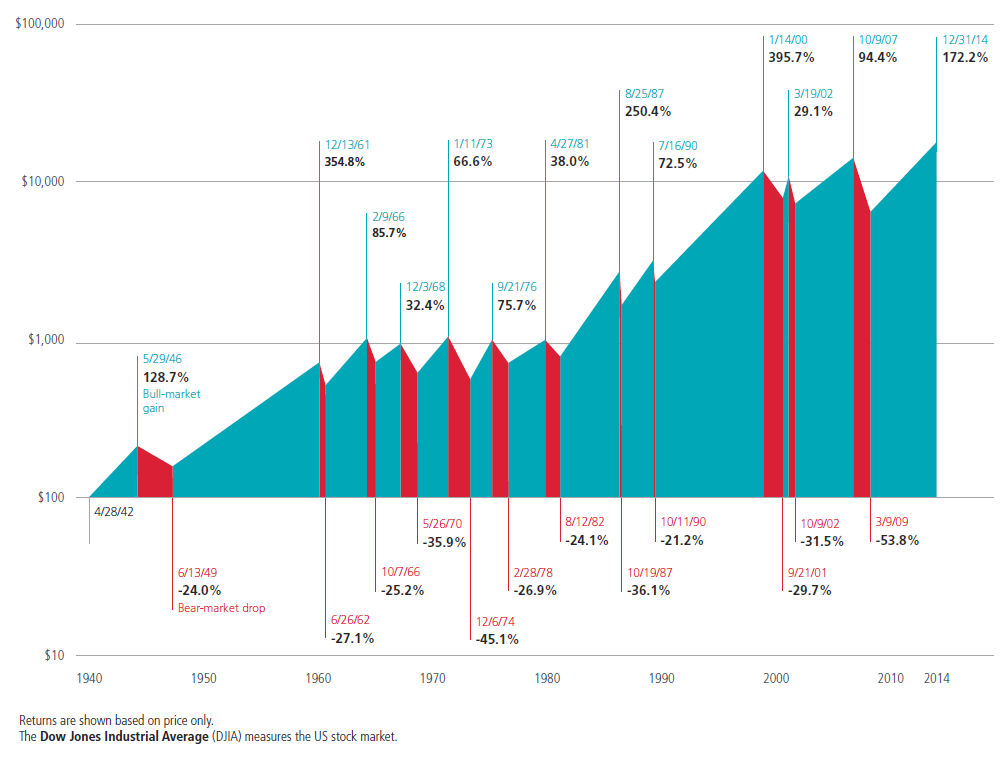
The Dow Jones Industrial Average is comprised of 30 stocks that are major factors in their industries and widely held by individuals and institutional investors. It is an unmanaged index that cannot be invested into directly.
What I do know is illustrated on this chart. In the past 70 years since WWII, there have been 14 bear markets highlighted by the red bar lines. According to my calculator, that is about one every five years. Downturns have taken an average of 15 months to go from peak to trough, and have fallen on average of about 30%.
Welcome to the real world. Since 1940 temporary drops of greater than 30% have happened pretty much every five years. And for the average two-person, 30 year retirement period, that’s six times. Over this time it was a repeatable pattern in equity investing. You can choose to avoid equities, but we believe the consequences of not being an equity investor will have serious ramifications on retirement income.
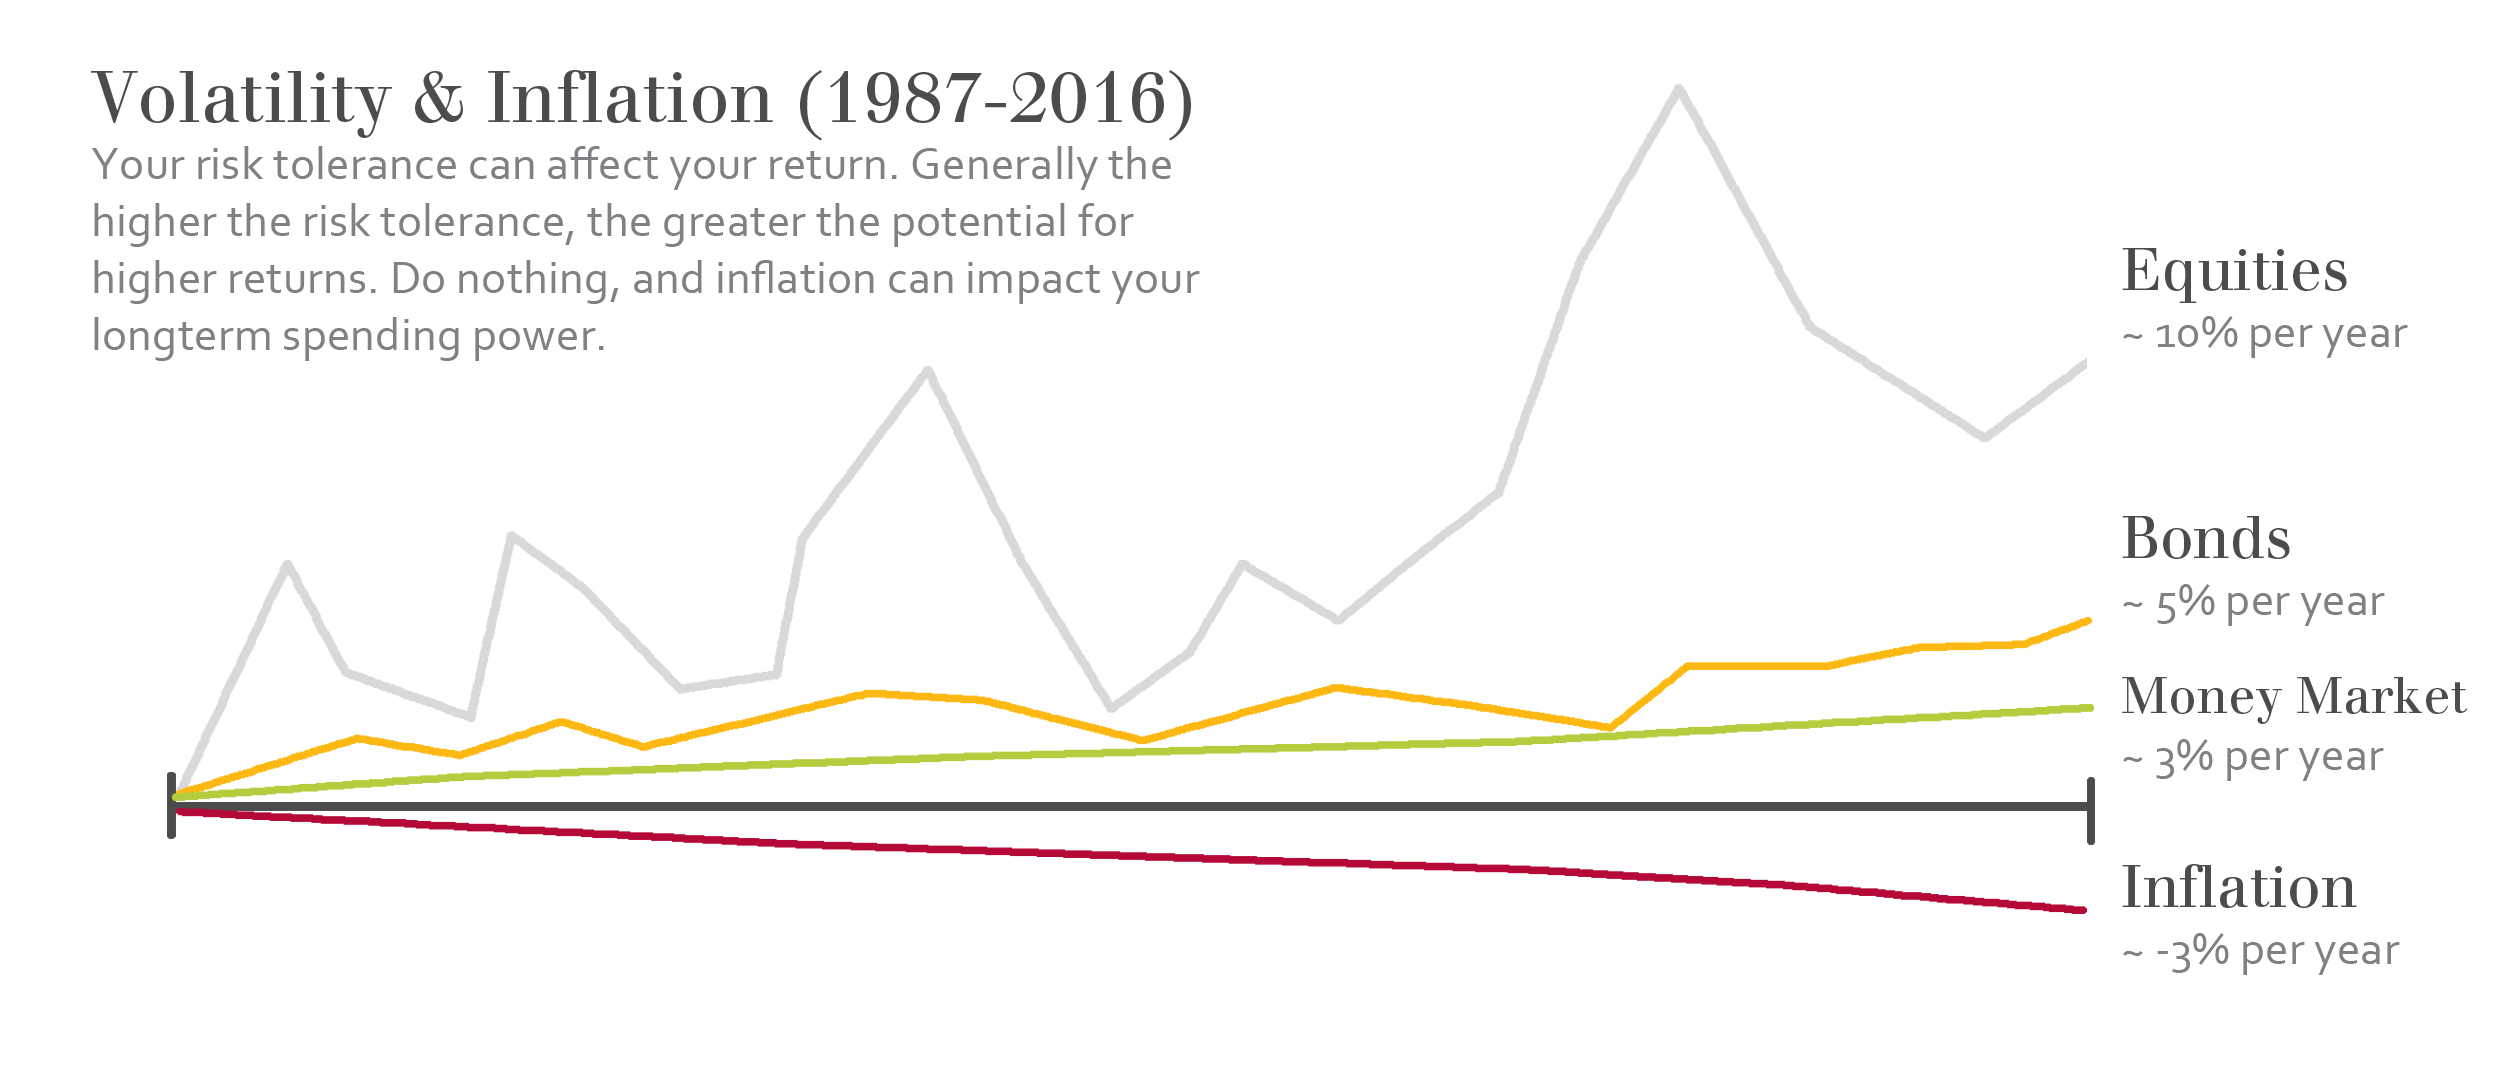
Here is another way of looking at fluctuation and purchasing power risk is this chart:
Figures based on LPL Research and Standard & Poor’s. All performance referenced is historical and is no guarantee of future results. All indices are unmanaged and may not be invested into directly.
The gray line representing equities* illustrates a lot of volatility or fluctuation in price. Yet over the past 30 years we see an average return of approximately 10% per year.
The yellow or second line (bonds**) illustrates less volatility, but only returned about +5% per year over the past 30 years. Less risk, less reward.
The light green or third line (money market or savings accounts) averaged approximately 3% per year. Stable in price, yet low return.
The red or bottom line that slopes lower illustrates the impact of inflation. You’ll notice this is approximately the same number (3%) as money market funds – certainly not in our recent history the past 7 years.
What some investors would consider to be a “safe” investment is all but safe when considering the impact of inflation on your long-term cash flow and the purchasing power of your money. Money market funds may be “secure” as they have little fluctuation, but clearly not “safe” when you consider inflation.
Inflation can be one of the biggest risks investors face, especially over a 30 or 40 year time period, which is the likely time horizon of a couple entering retirement at age 65. Inflation and longevity might be retirees’ biggest risks – not volatility.
Think of inflation as the hill we all must climb. Ignoring its effect on purchasing power can derail your financial plan. This is why we believe it is essential for investors to have rising income – income that is increasing at a rate greater than the inflation rate. If not, you are getting poor, slowly. And you will not notice it until it is too late.
If you would like to have a conversation about our investment philosophy and strategies, feel free contact us.
We welcome the opportunity to help others work toward having enough – and to protect their purchasing power.
*This is based on the Standard & Poor’s 500 Index which is a capitalization weighted index designed to measure performance of the broad domestic economy.
**This is based on the Barclays U.S. Aggregate Bond Index which is an index of the U.S. investment-grade fixed-rate bond market, including both government and corporate bonds
Steve Booren is the Owner and Founder of Prosperion Financial Advisors, located in Greenwood Village, Colo. He is the author of Blind Spots: The Mental Mistakes Investors Make and Intelligent Investing: Your Guide to a Growing Retirement Income and a regular columnist in The Denver Post. He was recently named a Barron’s Top Financial Advisor and recognized as a Forbes Top Wealth Advisor in Colorado.
Bonds are subject to market and interest rate risk if sold prior to maturity. Bond values will decline as interest rates rise and bonds are subject to availability and change in price.
Securities and advisory services offered through LPL Financial, a registered investment advisor, Member FINRA/SIPC.
The opinions voiced in this material are for general information only and are not intended to provide specific advice or recommendations for any individual.