The U.S. Economy & Markets
I am an optimist by nature. I feel this optimism is not pie-in-the-sky wishful thinking, but rather a view to the future that is based on a sound historical tract record and the economic progress we see across the globe. This optimism springs from characteristics that aren’t uniquely American, but we certainly are blessed by a population that exhibits many of these attributes:
- Hard work
- Ingenuity and creativity
- Kean intellect
- An entrepreneurial spirit
- Productivity, efficiency, and a striving for improvement
- Cutting edge mentality
- Yet fun, fruitful, and an ever growing vision of what the future might hold
All of these characteristics, and many more, benefit our society and many people around the globe like no other time in history, raising countless number of people out of poverty and into a better life.
Because of this optimistic view toward our economy, I am also an optimist regarding our capital markets.
Let me show you a picture. It is a chart dating from 1926 through 2017. I know you can’t see all the details, but that is alright. For my intention is to impress upon you a trend line.
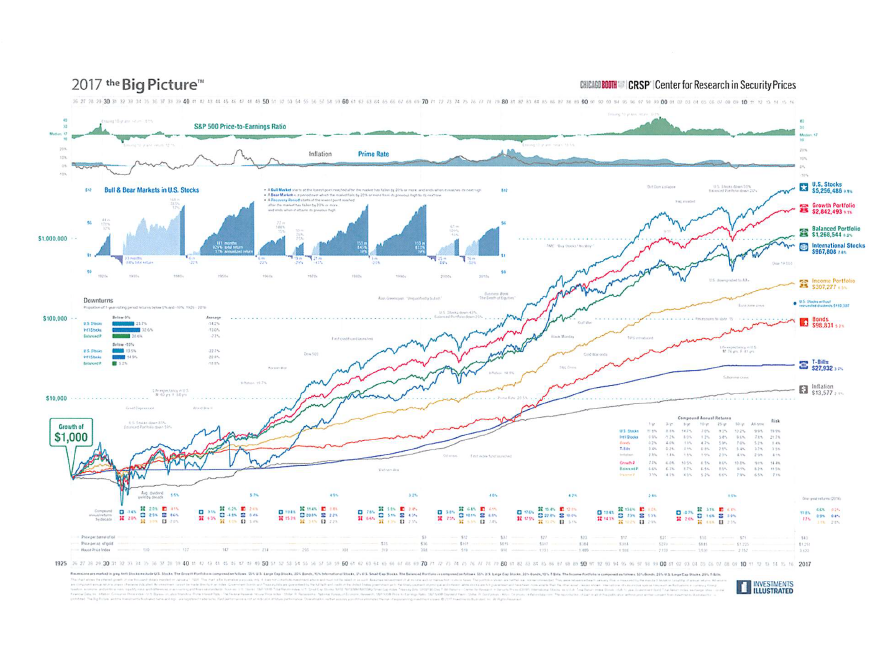
The top line is the S&P 500 index, representing the boarder stock market. What did we in the US and the people of the world experience at some point during these years?
- The Great Depression
- WW II
- Inflation at 19 %
- The Korean War
- The Vietnam War
- The assassination of world leaders
- An Oil Crisis in early 70’s
- Prime interest rate hitting 20.5%
- An article in Business Week: 1978- The death of equities
- Black Monday- a one day drop of 20 %( one year later, not only a recovery of the 20% loss, but actually ahead by 23%)
- The Savings and Loan Crisis
- An article in Time magazine: 1988- Buy Stocks? No Way!!
- The Gulf War
- The Dot Com Bust
- 9/11
- 2008- what was thought to be the potential of a global financial meltdown
Throughout this almost 100 year history, what was the unmitigated trend line of the market?
During this period, the S&P 500 averaged a 9.9% annual increase. There are certainly periods of time when the markets were down. But this has been proven to a temporary interruption of a very powerful trend line.
But you say: Dave, I don’t have a 90 year investment horizon. Or maybe: “It is different this time”. Well let’s take a look at another chart. This chart starts on January 1, 2008 to the end of 2017.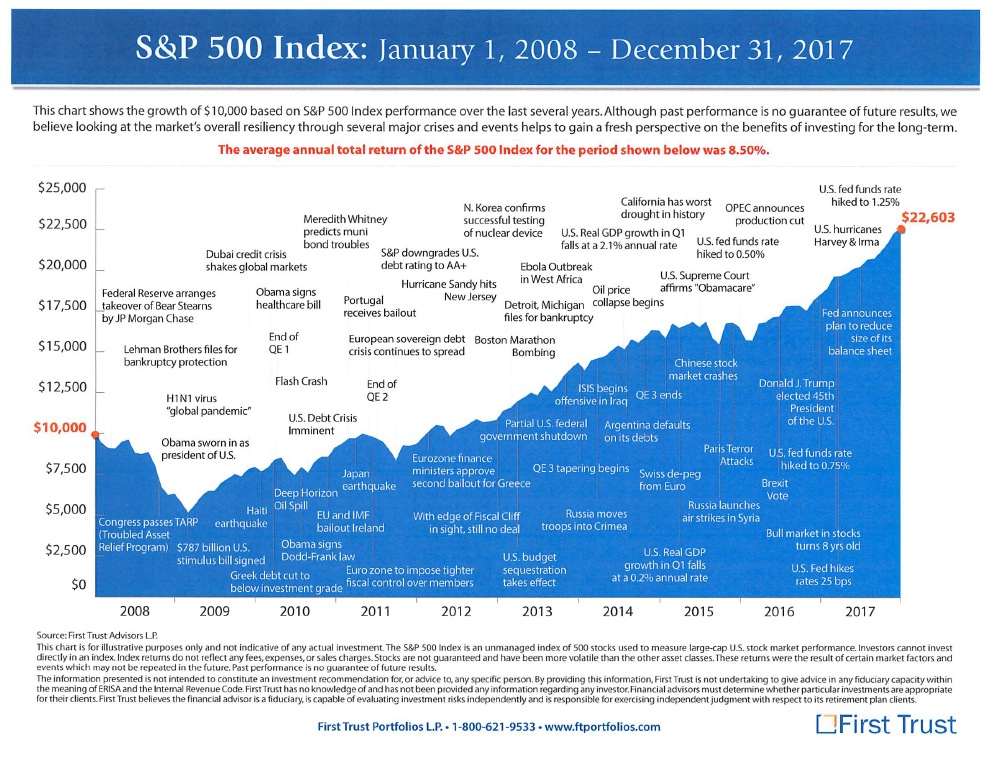
Please notice the trend line here as well. This period of time includes:
- The great Recession- what was thought to be a global financial meltdown
- The fear of H1N1 and Ebola virus turning into a global pandemics
- Dubai, Greece, Portugal, Argentina and Detroit severe financial issues and bankruptcy
- Deep Horizon Oil Spill, Japan Earthquake and resulting nuclear disaster
- ISIS- the rise of global terrorism- Paris, Boston and many other tradegies.
- North Korea nuclear device confirmation
- Russian aggressions- Syria, Ukraine, US meddling
Yet through this short time period, the markets continue to move higher.
We have been in an unprecedented time of low volatility the past several years. But as we have anticipated, in the past couple of weeks we have seen the return of volatility to the markets. I feel strongly that periods of dislocation in the markets where chaos, uncertainty, fear and even panic are experienced, they have all been proven to be short term interruptions of the historical trend of market results.
So what drives the markets higher over time?
- Hard work
- Ingenuity and creativity
- Kean intellect
- An entrepreneurial spirit
- Productivity, efficiency, a striving for improvement
- Cutting edge mentality
- An ever growing vision of what the future might hold
All of these add up to growing revenues and profits for companies, which then is typically rewarded by increasing stock values over time.
As we all know: “past performance is no guarantee of future returns”, however, we can learn from and base reasonable expectations on factual history and sound information.
I am optimistic about our economy and the markets as we all build a more hopeful financial future together.
As an advisor, Dave Anderson places a high priority on developing strong personal relationships with his clients. Frequent communication is important so that he works from an informed and timely view of his clients personal and life goals, financial objectives, priorities and risk tolerance. Learn more about Dave here.
All market indexes discussed are unmanaged and are not illustrative of any particular investment. Indexes do not incur management fees, costs and expenses, and cannot be invested into directly.
The S&P 500 Index is a capitalization-weighted index of 500 stocks designed to measure performance of the broad domestic economy through changes in the aggregate market value of 500 stocks representing all major industries.
Investing involves risks, including possible loss of principal. No investment strategy or risk management technique can guarantee return or eliminate risk in all market environments.